Following proper temperature measurements is important to creating a reliable graph. But having built a graph, it is also important to understand what it says. a gynecologist interprets the graphs . On this page you will find basic explanations of the graphs. Please note that the chart can only be evaluated at the end of the cycle . And so, what you need to pay attention to.
- Middle line on the basal temperature chart
- Ovulation line
- Anovulatory cycle
- Cycle length
- Length of the second phase of the cycle
- Temperature difference
- In what cases should you consult a gynecologist?
Middle line on the basal temperature chart
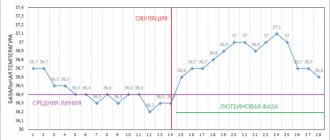
This line is drawn over 6 temperature values in the first phase of the cycle preceding ovulation.
This does not take into account the first 5 days of the cycle, as well as days on which the temperature could be affected by various negative factors (see rules for measuring temperature). This line does not allow any conclusions to be drawn from the graph and is for illustrative purposes only.
BT during pregnancy
A high basal temperature during conception is explained by the fact that the level of hormones in the body changes. This is necessary to prepare the uterine wall for the attachment of an egg that has been fertilized. High levels (37.1°С -37.3°С) will be observed for a very long time – on average about four months. Only then will they gradually begin to decline and return to normal. That is why after week 20, maintaining a personal schedule is pointless.
Ovulation line
In order to judge the onset of ovulation, this site uses the rules established by the World Health Organization:
- Three temperature values in a row must be above the level of the line drawn over the previous 6 temperature values.
- The difference between the center line and the three temperature values must be at least 0.1 degrees on two days out of three and at least 0.2 degrees on one of those days.
If your temperature curve meets these requirements, then an ovulation line will appear on your chart 2 or 3 days after ovulation:
Sometimes the program fails to determine ovulation using the WHO method because you have high temperatures in the first phase of your cycle. In this case, you can “help” the program and apply the “finger rule” to the graph. This rule excludes temperature values that differ from the previous or subsequent temperature by more than 0.2 degrees . If you have such temperatures in the first phase of the cycle, then about in your diary on these days. Such values should not be taken into account when calculating ovulation if the overall graph is normal.
The most optimal time for conception is the day of ovulation and 2 days before it. According to medical statistics, the rise in body temperature and the onset of ovulation are expressed in the following ratio:
- 2% - 4 days before fever rises
- 2% - 3 days before fever rises
- 21% - 2 days before fever rises
- 30% - 1 day before fever rises
- 30% - 1 day after fever rises
- 15% - 2 days after fever rise
How to read a chart to determine ovulation?
In order to determine ovulation by basal temperature, it is important to correctly record temperature readings and draw a chart correctly, otherwise the whole point of building a chart is lost.
Before the egg matures, the temperature will fluctuate between 36.6-36.9 degrees. The middle of the monthly cycle is characterized by a decrease in degrees. If the thermometer showed a temperature of 36.8 for several days in a row, and then 36.6, then we can say that this is the beginning of ovulation in the body.
Anovulatory cycle
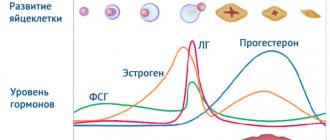
In a cycle without ovulation, the corpus luteum, which produces the hormone progesterone and affects the increase in body temperature, does not form. In this case, the temperature rise is not visible on the graph and ovulation is not detected. If there is no ovulation line on the graph, in this case we are talking about an anovulatory cycle:
Each woman may have several anovulatory cycles per year - this is normal and does not require medical intervention, but if this situation repeats from cycle to cycle, then be sure to contact the gynecology center . Without ovulation, pregnancy is impossible!
Ovulation is not calculated or is determined “incorrectly”
Firstly, remember that ovulation is calculated by a program based on a certain algorithm, and the female body is not always predictable by computer algorithms. The program tries to calculate ovulation based on your data, but no one, not even a doctor, can give an answer with an absolute guarantee about when ovulation actually occurred unless you stimulate ovulation and are observed at least once every two days by a doctor for an ultrasound. .
If all the rules for measuring basal temperature have not been followed, then it is difficult for the program to make an accurate calculation.
Signs such as the nature of cervical fluid and ovulation tests are not taken into account for the calculation, since these signs are very subjective. Look in the gallery of graphs - when measured in compliance with all the rules, these signs very often coincide with the calculations of the program. If they do not match, then hormonal disorders can be assumed. Egg whites and ovulatory pain are not signs of ovulation according to WHO; their manifestation is possible without subsequent ovulation. Many programs take these signs into account, draw ovulation, and then it turns out that “ovulatory pain from kidney stones”, and the character of the cervical fluid was “very similar to egg white”. The result of such calculations can be disastrous, as you yourself understand. Programs that “learn” to calculate ovulation based on indirect signs you specify do not give a clear picture and may erroneously show ovulation from cycle to cycle just because you noted ovulatory pain and “egg white” on a certain day.
Remember also that if conception was possible only on the day of ovulation, then people would have died out long ago. Sexual intercourse during the period covered by three days before ovulation and one day after ovulation gives the same chance of conception as intercourse on the day of ovulation.
Length of the second phase of the cycle
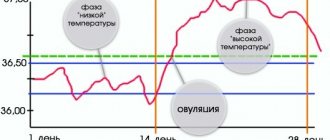
The basal temperature chart is divided into the first and second phases. The division takes place where the ovulation line (vertical line) is marked. Accordingly, the first phase of the cycle is the segment of the graph before ovulation, and the second phase of the cycle is after ovulation.
The length of the second phase of the cycle is normally from 12 to 16 days, most often 14 days. In contrast, the length of the first phase can vary greatly and these variations are the individual norm. At the same time, in a healthy woman in different cycles there should be no significant differences in the length of the first phase and the second phase. The total length of the cycle normally changes only due to the length of the first phase.
One of the problems identified on the graphs and confirmed by subsequent hormonal studies is the failure of the second phase. If you measure your basal temperature over several cycles, following all the measurement rules, and your second phase is shorter than 10 days, this is a reason to consult a gynecologist . Also, if you regularly have sexual intercourse during ovulation, pregnancy does not occur and the length of the second phase is at the lower limit (10 or 11 days) , then this may indicate insufficiency of the second phase.
Is it possible to determine that fertilization has occurred?
The length of the menstrual cycle in different women can fluctuate by 2 weeks, but the changes are in the first phase. The second part of the cycle always lasts up to 12-14 days. A jump in temperature during ovulation indicates menstruation, but if this change continues for more than 2 weeks, it is a clear sign of pregnancy.
During pregnancy, menstruation does not occur, and the thermometer readings are always slightly higher than normal.
Interesting! If the basal temperature is lower, there is likely to be a deficiency of hormones that protect pregnancy and there is a risk of miscarriage.
In what cases should you consult a gynecologist?
If you strictly follow the rules for measuring temperature and observe the problems described below on your chart in at least 2 cycles in a row, you can consult a doctor for additional examinations. of your gynecologist making diagnoses based solely on charts. What you need to pay attention to:
- anovulatory schedules
- regular cycle delays when pregnancy does not occur
- late ovulation and failure to become pregnant for several cycles
- controversial charts with unclear ovulation
- graphs with high temperature throughout the cycle
- graphs with low temperature throughout the cycle
- schedules with a short (less than 10 days) second phase
- graphs with a high temperature in the second phase of the cycle for more than 18 days, without the onset of menstruation and a negative pregnancy test
- unexplained bleeding or heavy discharge mid-cycle
- heavy menstruation lasting more than 5 days
- graphs with a temperature difference in the first and second phases of less than 0.4 degrees
- cycles shorter than 21 days or longer than 35 days
- charts with clearly defined ovulation, regular intercourse during ovulation and no pregnancy occurring for several cycles
Features of measuring rectal temperature
The essence of the method is to measure the temperature rectally over several months, constructing a graph for each cycle from the obtained figures. To learn how to measure rectal temperature to determine ovulation, let's get acquainted with the basic rules:
- take measurements first thing after waking up; you should not make unnecessary movements and even get out of bed; you need to sleep fully (from 6 hours); carry out the procedure at the same time; do not replace the thermometer; hold the thermometer only by the upper end, and “shake” it the night before; When noting temperature readings, be sure to indicate possible causes of deviations (undergoing a course of treatment, drinking alcohol).
We looked at how rectal temperature is measured during ovulation, how reliable is it and are there any disadvantages? The advantages of the method are very extensive:
- can be done at home, on your own; no costs (only a thermometer is required); simple and affordable; regular measurements make it possible to calculate not only the day the cell is released, but also the onset of pregnancy.
A very detailed video, be sure to watch if you want to understand the measurement of rectal temperature during ovulation:
But measuring temperature rectally for ovulation does not give a 100% guarantee. An error or malfunction in the functioning of the body is always possible. This is the main drawback inherent in almost any method of identifying the day a cell emerges. Therefore, it is worth additionally confirming the result with another option: tests or ultrasound. The latter, by the way, is the most reliable. With timely observations, it shows the stages of follicle formation, the moment of rupture, the passage of the cell through the tubes and successful conception when the cell is attached to the uterus. Tests are subject to error, but they are easy to use at home.
When to take readings
How to measure basal temperature?
This process does not require any special preparation. But in any case, a woman will have to remember some rules. In addition, it is necessary to understand the decoding of the received data. You only need to take your temperature in the morning. In the evening or during the day, the readings on the thermometer will be inaccurate. And then the BT schedule will be distorted. To the point that a woman will not be able to determine pregnancy or ovulation.
Moreover, when obtaining data on basal temperature, you need to remember one simple rule - all manipulations are performed every day at the same time. It is advisable to do this at 6-7 am, immediately after waking up.
Important: if a woman works the night shift and sleeps in the morning and during the day, then measurements during the daytime are allowed. The main thing is to rest for about 6-8 hours
Only proper sleep and lack of physical activity will help to obtain the most accurate information.


